



 Authors: Rapant, S., Vrana, K., Bodiš. D. et al. | Year of publication: 1996
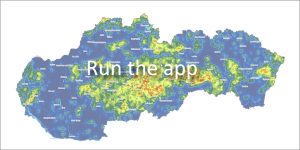
The web application presents the results of regional hydrogeochemical mapping of the first aquifer (springs, wells and boreholes). It serves as a reference basis with a database of 16,359 groundwater samples, which allows for comparison and assessment of future changes in water quality at both the national and regional levels.
📊 Cartographic processing and map types
The distribution of monitored elements and physicochemical parameters is shown in the graphic part using two types of maps:
1. Area (diffusion) maps
They are used for elements where less than 50% of the values lie below the limit of determination.
-
Visual traffic light principle: The color scale is created based on percentiles – from the lowest concentrations (blue color) to the highest values (red color).
-
Monitored parameters: pH, water hardness, total dissolved solids, aggressive CO₂, calcium, magnesium, sodium, potassium, nitrates, sulfates, chlorides, fluorides, bicarbonates, chemical oxygen demand, silicon dioxide, barium, aluminum (unfiltered), lithium, strontium, copper, zinc and iron.
2. Point maps
They occur in cases where the conditions for area modeling are not met. They show element concentrations directly at the sampling points, with the size of the symbol expressing the concentration interval.
-
Monitored parameters: Ammonium, antimony, arsenic, phosphates, aluminum, chromium, cadmium, manganese, lead, mercury and selenium.
📂 Atlas document for download
📖 Citation of the work:
RAPANT, S; VRANA, K.; BODIŠ, D. et al.: Geochemical Atlas of Slovakia, Part I: Underground Waters [online]. Bratislava: Dionýz Štúr State Geological Institute, 1996. Available at: https://app.geology.sk/atlaspv/.
📅 About the application
Application launch: 04/2011