



Author: Šimeková J. et al. | Release year: 2006
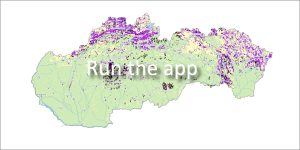
🗺️ The application includes access to two maps.
The guarantor of the research was the State Geological Institute Dionýza Štúr (SGIDŠ).
1. Atlas of slope stability maps of the Slovak Republic – Map of slope deformations
Slope deformations (landslides, block races, soil creep) represent an important geodynamic phenomenon in Slovakia and a permanent risk for construction objects and infrastructure. They cover up to 5.25% of the area of Slovakia. The risk is currently increasing with the shift of construction activity to more sloping and attractive mountain areas, where the availability of flat land is limited. This atlas, compiled in the years 1999-2006, uses a uniform methodology to process the landslide areas registered up to that time.
📊 Statistics and display method in GIS
The application contains a total of 21,029 recorded slope deformations. Due to the scale limits of 1:50,000, two types of objects are distinguished in the map:
-
🟢 Small area slope deformations (4,794 objects): Dimensions are smaller than 20 × 50 meters. Their exact outlines cannot be shown, so they are represented as colored point symbols according to activity at the time of mapping.
-
📐 Large-scale slope deformations (16,235 objects): Dimensions are larger than 20 × 50 meters. They are displayed in the form of real contours (polygons) over the SVM 50 topographic base. Color and hatching express the degree of their movement activity.
2. Atlas of slope stability maps of the Slovak Republic – Map of the territory’s susceptibility to slope deformations
This map was created using an empirical method and shows three basic areas of susceptibility (the so-called “traffic light principle” – shades of green, yellow and red). Within the regions, subregions I – III.C are also separated, while the increasing susceptibility to sliding is expressed by increasing color saturation. A brief description is prepared for each sub-district. It uses an intuitive three-level rating:
🚦 Map of territory susceptibility (“Traffic light principle”)
-
🟢 Green shades: Low susceptibility / stable territories.
-
🟡 Yellow shades: Medium susceptibility / conditionally stable areas.
-
🔴 Red shades: High susceptibility / unstable risk areas.
⚠️ Important notice for builders and municipalities:
The map is indicative and is not a binding basis for territorial proceedings. In risky locations, or where archive data is missing, it is necessary to conduct a detailed engineering geological or geotechnical survey before starting construction.
📂 Original map attachments for download (scale 1 : 50,000):
👉 [ Frequency of occurrence of slope deformations (PDF) ]
👉 [ Area of disturbance of the territory by slope deformations (PDF) ]
👉 [ Slope Deformation Susceptibility of the Territory (PDF) ]
📅 About the Application
Application Launch: 06/2017